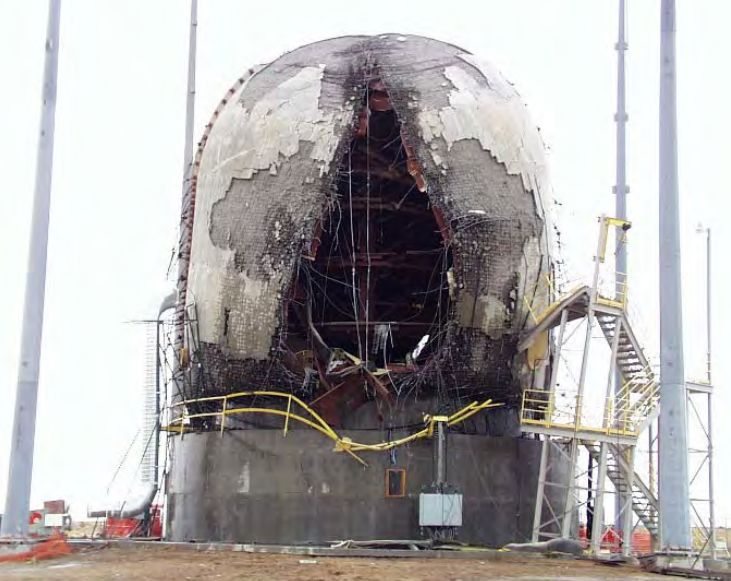
The amount of time and effort that goes into making sure that nuclear plants safe is incredible. In the early 80s, Sandia National Labs (SNL) and Argonne National Labs (ANL) started a testing program for testing Reactor Containments. The pinnacle of the series of tests was the 1/4 scale model of a typical PWR Containment that they tested in 2000. You can see the carnage from the test in the picture above.
Understanding the Three Safety Barriers in Nuclear Plant Containment
Before we take a look at the test, we need to look at the three barriers that all nuclear plants have to protect the health and safety of the public. If there is a nuclear accident of any kind at a Nuclear Plant, these are the three barriers that keep the radioactive elements contained:
- Fuel cladding
- Zirconium alloy encasing the fuel
- Reactor Coolant System
- Very thick steel containing fuel and hot water
- Reactor Containment (Containment)
- Building containing the Reactor Vessel/System
If the Reactor Coolant System fails, then the hot water in the system will turn into steam, and pressurize the Containment.
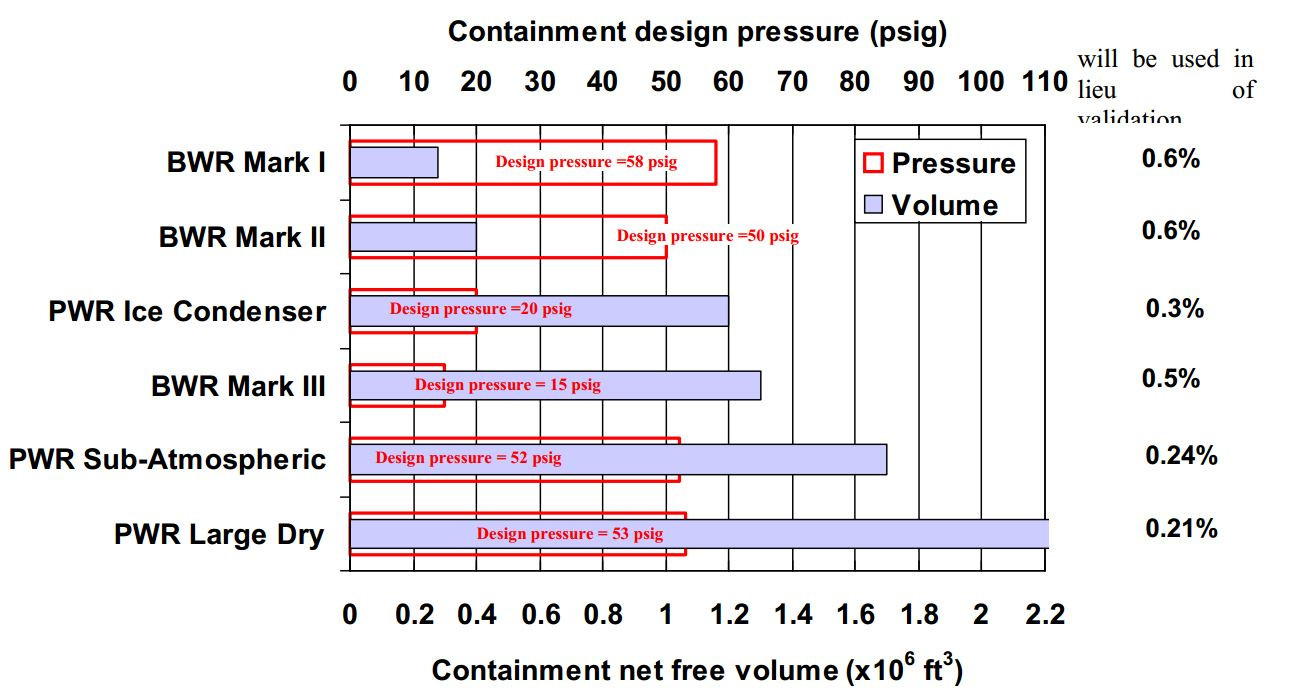
The Containments in use in the USA today were, for the most part, designed before 1980. Since they didn’t have the kind of methods and computational power that we have today, the designs were built with a large amount of conservatism. Depending on the type of Containment, these buildings could withstand up to about 60 psig. The graph below is from NRC NUREG-CR-6906 showing the average Containment Design Pressures. It should be noted that these are design limits, and even during an accident, these limits wouldn’t be challenged.
Primer on Containment Types
There are about 6 main types of Containment structures in use in the USA today. SNL tested each of these designs of the 20+ year testing campaign.
BWR Mark I
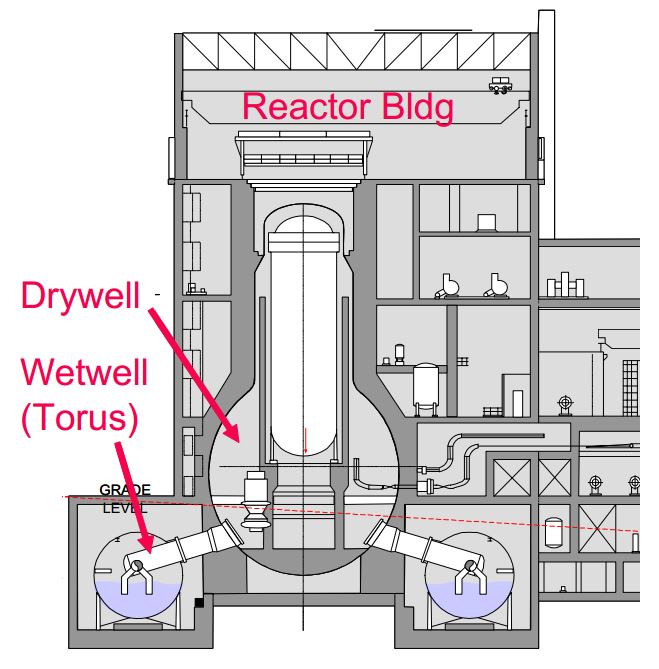
BWR Mark I Containments use a suppression pool (torus) to absorb energy and reduce pressure. During an accident, the steam would flow into the torus where it’s condensed.
These plants have a Mark I Design:
- Free standing Steel
- Nine Mile Point 1
- Oyster Creek
- Dresden 2/3
- Monticello
- Pilgrim 1
- Quad Cities 1/2
- Browns Ferry 1/2/3
- Cooper
- Duane Arnold
- Fermi 2
- FitzPatrick
- Hatch 1/2
- Hope Creek 1
- Peach Bottom 2/3
- Reinforced Concrete with Steel Liner
- Brunswick 1/2
BWR Mark II
Mark II Containments are very similar to Mark I Containments. The engineers simplified the design of the suppression pool, and unified the entire Containment Structure. For the Mark II Containments, the Suppression Pool simply sits in the wetwell below the drywell.
These plants have a Mark II Design:
- Free standing Steel
- Columbia
- Reinforced Concrete with Steel Liner
- Limerick 1/2
- Susquehanna 1/2
- Nine Mile Point 2
- Post-Tensioned Concrete with Steel Liner
- Lasalle 1/2
BWR Mark III
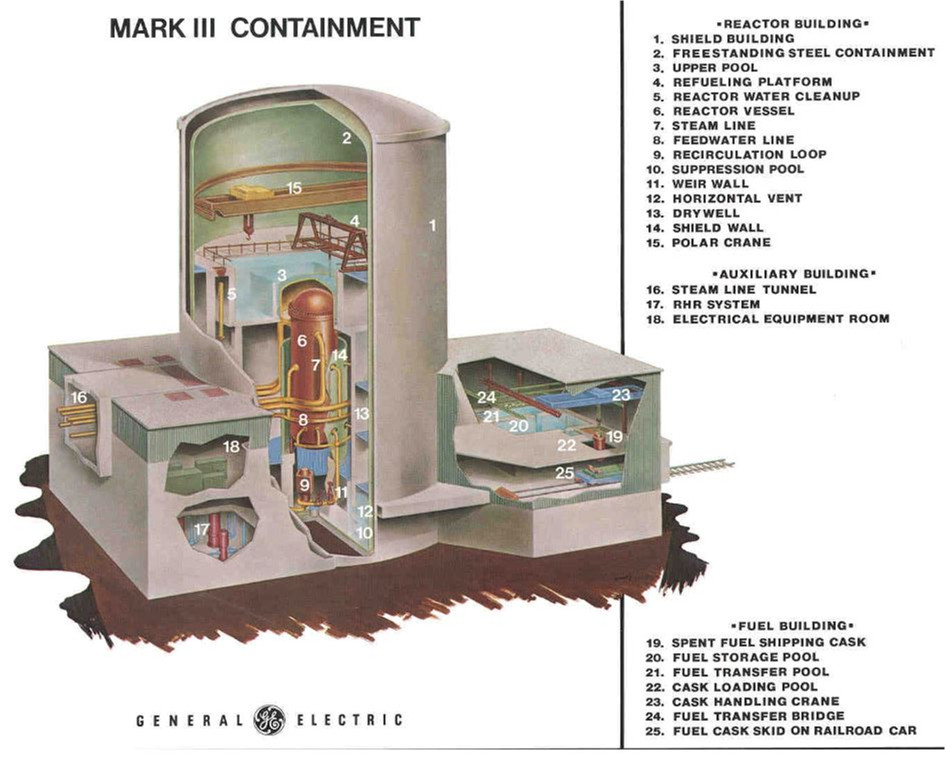
These Containments have a drywell like Mark I and II Containments, but have a larger surrounding containment that includes the wetwell. The suppression pool is located in an annular region outside the drywell. If the pressure in the outer containment exceeds the pressure in the drywell, then vacuum breakers open to equalize the pressure. The primary visual difference with the Mark III is the outer containment around the drywell, which effectively provides a double layer of protection.
These plants have a Mark III Design:
- Free standing Steel
- Perry 1
- Riverbend 1
- Reinforced Concrete with Steel Liner
- Clinton 1
- Grand Gulf 1
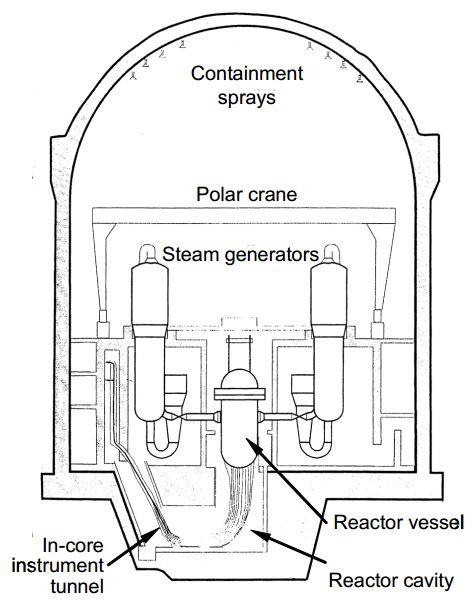
PWR Ice Condenser
Ice Condenser Containments are different because they rely on an entirely passive system to mitigate a large break of the Reactor Coolant System. This design uses an ice bed (block of ice). During an accident, the ice cools the steam and condenses it, thus reducing the pressure in Containment.
These Plants have an Ice Condenser Containment:
- Sequoyah 1/2
- Watts Bar 1
- Catawba 1/2
- McGuire 1/2
- DC Cook 1/2
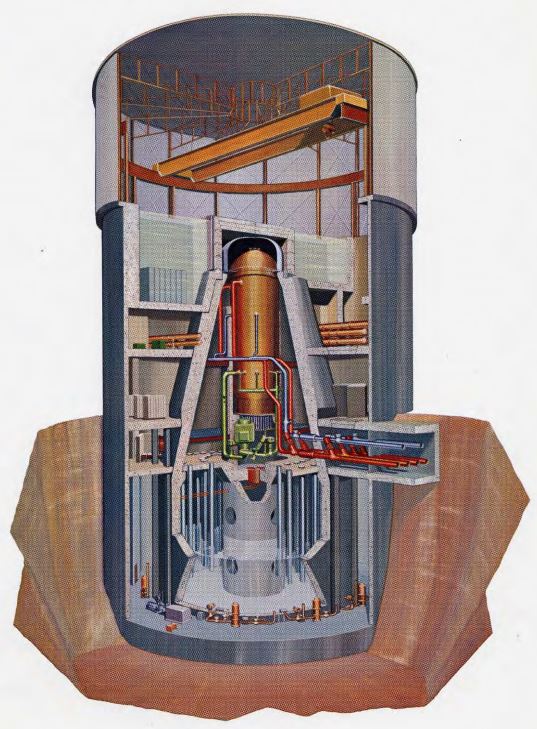
PWR Large Dry
A large dry Containment is designed to withstand a failure of the Reactor Coolant System as well as a single failure of a supplementary cooling/depressurization system (Containment Spray/Fan Coolers, etc.). These Containments all have stainless steel liners to ensure leak tightness.
These sites have large dry Containments:
- Kewaunee
- Prairie Island 1/2
- Davis-Besse
- St. Lucie 1/2
- Waterford 3
- Commanche Peak 1/2
- Diablo Canyon 1/2
- Indian Point 2/3
- Salem 1/2
- Shearon Harris 1
- Seabrook 1
- Ginna
- HB Robinson
- Fort Calhoun
- Millstone 2
PWR Sub-Atmospheric
Sub-Atmospheric Containments are similar to large dry Containments, except they’re kept at a negative pressure. This ensures that any leakage will be into the Containment, not out. It also gives margin against over-pressurization by being at a lower pressure at the start of an accident.
These sites have sub-atmospheric Containments:
- Beaver Valley 1
- Beaver Valley 2
- North Anna 1/2
- Surry 1/2
- Millstone 3
Time for Testing
Nuclear plants are incredibly safe because of the amount of analysis and testing that goes into them. By the time the Containment would be challenged, a number of other failures would need to happen at the same time, or in quick succession. These probabilities are calculated, and the ultimate probability of an accident is determined. One of the key problems with these estimates was that test data was missing for Containment Structures. Utilities had to use analytical bases, until Sandia started testing.
The test program spanned from 1980 to 2003, during which time, over a dozen scale model tests were performed. The duration and scope of this test program make it one of the biggest test programs ever undertaken in the Nuclear Industry.
The biggest test that Sandia did was the ¼ scale test of a Pre-Stressed Concrete Containment Vessel (PCCV). A scale model of the Japanese Ohi-3 Containment was built, filled with water, and pressurized until it failed.
Building The Model
The ¼ scale model built by Sandia in 2000 was about 37 feet in diameter, and 53 feet tall not counting the basemat. The amount of rebar can’t be understated. As you can see in the image below, it’s almost enough rebar to blot out the sun.
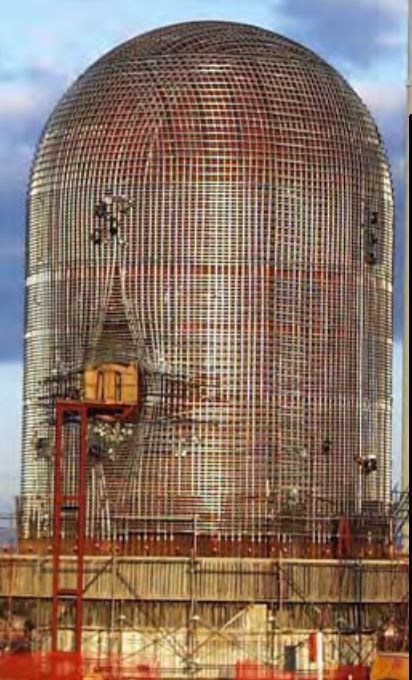
This model is a pre-stressed design. In this design, the vessel is pre-stressed, squeezing on the structure. This design gives more margin to failure when the inside of the Containment gets pressurized.
Conducting the Test
After construction, the model was ready for testing. First, SNL pressed the model up to about half of the design pressure just to check for leak tightness and make sure the vessel responded as expected. After that, SNL pressed the model up above the design pressure to take some measurements, and find where the first failure would occur. This test was called the Limit State Test (LST)
The test engineers pressed the model up to 2.5 times the design pressure using Nitrogen. At about 2.4 times the design pressure, one of the operators noticed a change in acoustics, indicating that there was likely a tear in the liner.
After this test, SNL wanted to measure the response of additional loads on the structure. The model was again pressurized up to 3.3 times the design pressure. At this point, the leakage from the tear was greater than the capacity of the system, and the test was terminated. The Containment model had been pressurized to about 180 psig!
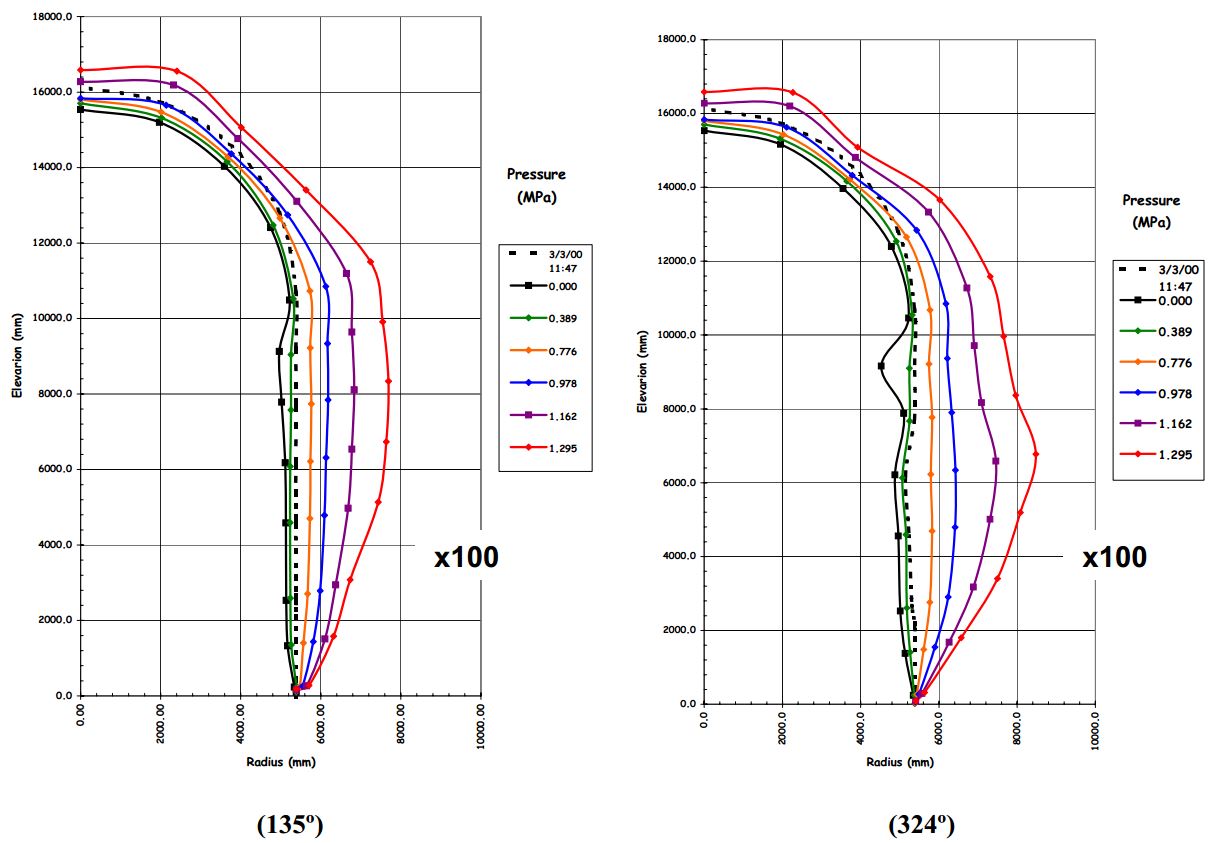
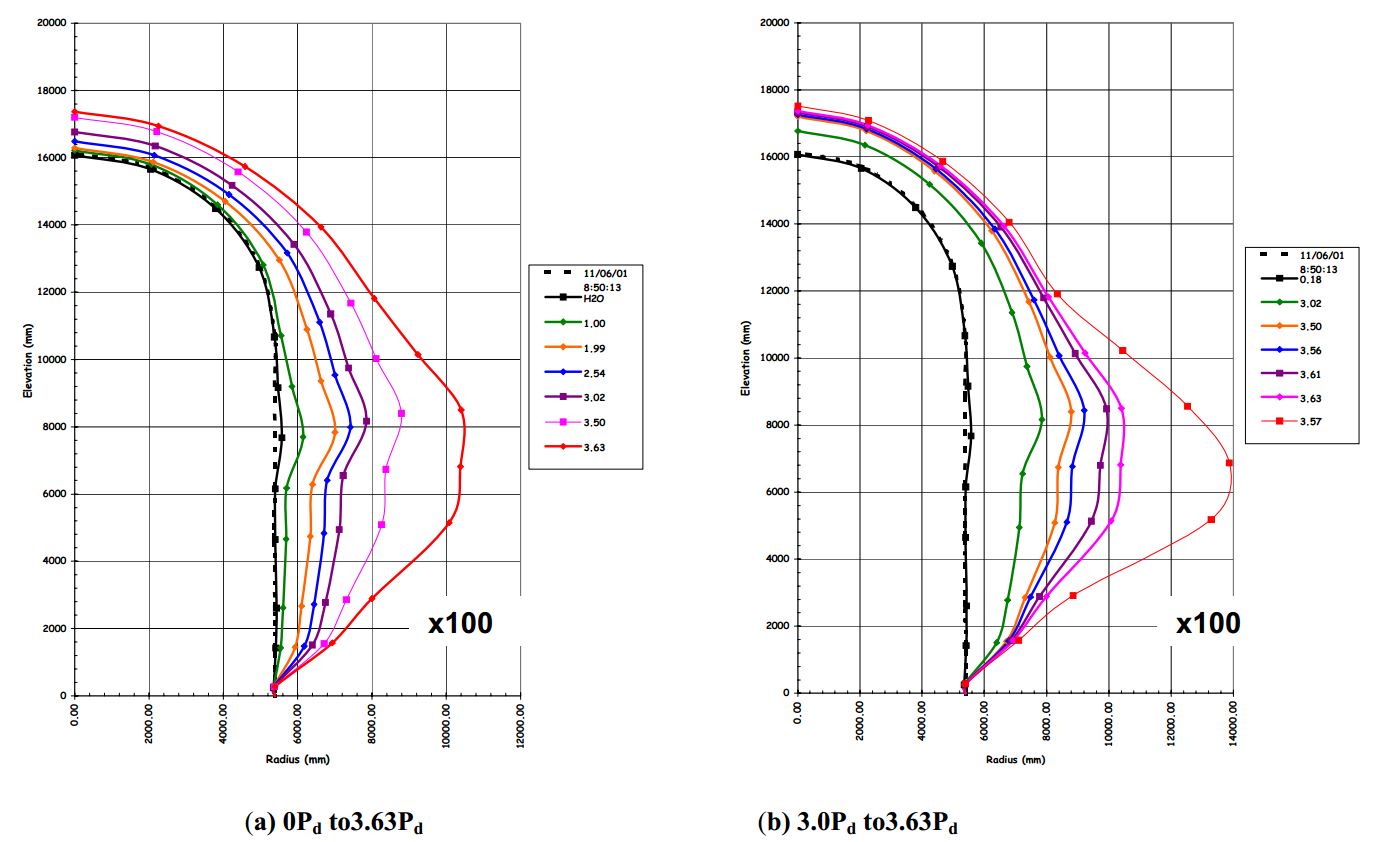
One of the measurements they were able to take was the growth of the Containment. As it was pressurized, it got taller, and wider. The figure below shows the growth of the model.
Structural Failure Test
After the tears were identified, they were sealed so that the structural failure could be tested. To make sure the structure could be pressurized reasonably quickly, most of the Containment was first filled with water. Only the top 5% of the volume contained nitrogen.
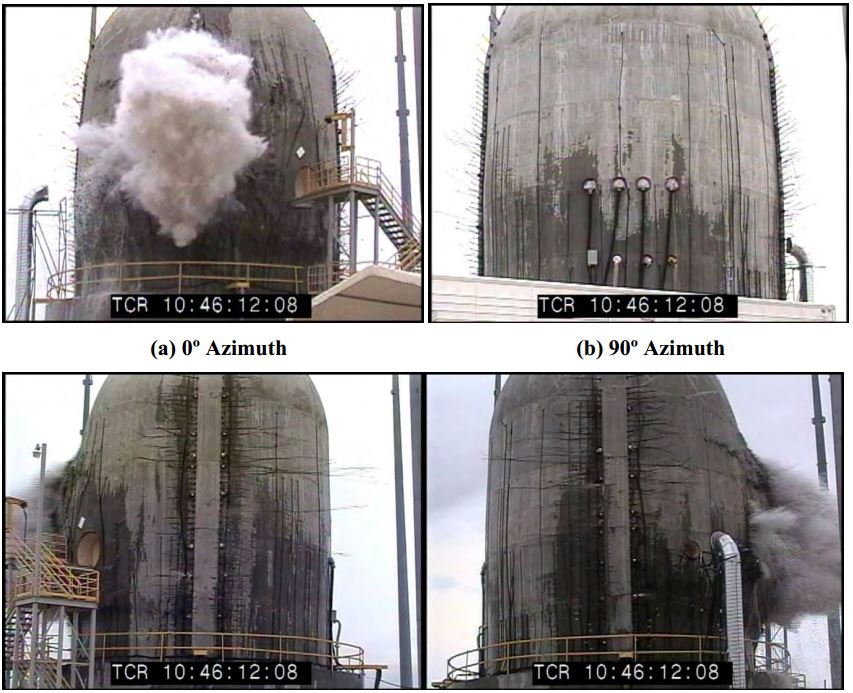
As test operators pressurized the vessel, they could see wetting along the sides of the Containment, indicating that there was a leak. The continued to press up the model to about 3.3 times the design pressure. At this point, the acoustic monitors picked up a large sound, which was likely the failure of one of the tendons used to pre-stress the concrete. At this point, was was seen spraying the side of the building. The acoustic monitors continued to pick up tendon breaks. Operators had to increase the nitrogen flow to maintain the pressurization rate (about 5 psi/min).
Finally, at 3.63 times the design pressure, the Containment ruptured.
Data
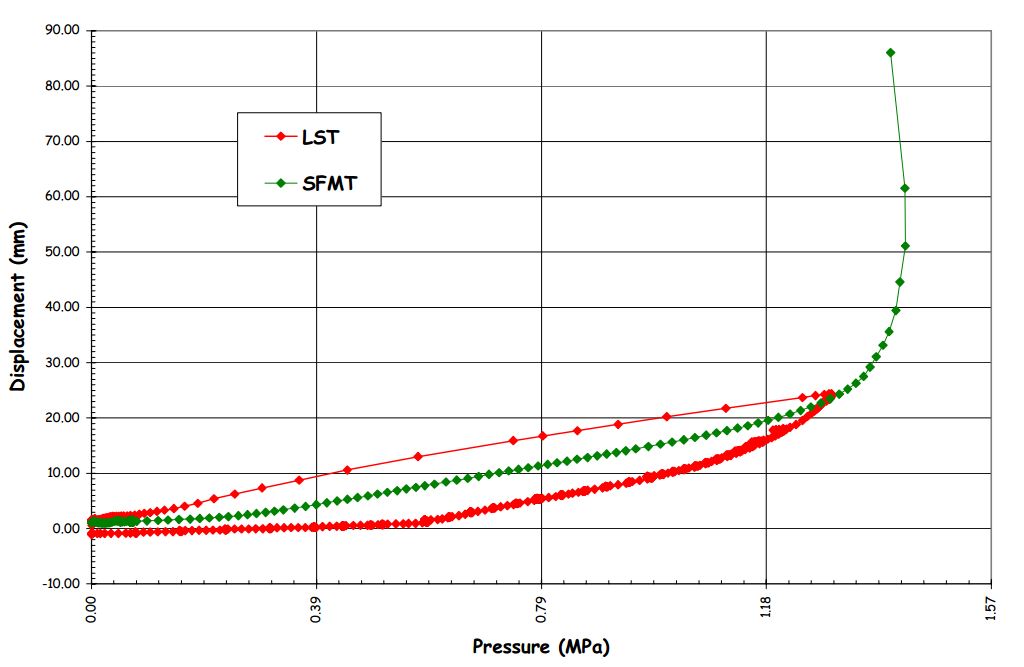
The data that Sandia got from these tests is fantastic. The plot below shows the displacement of the wall near the location of the failure. You can see that the first test and second test displace and about the same rate, which proves that the structure wasn’t damaged during the first test.
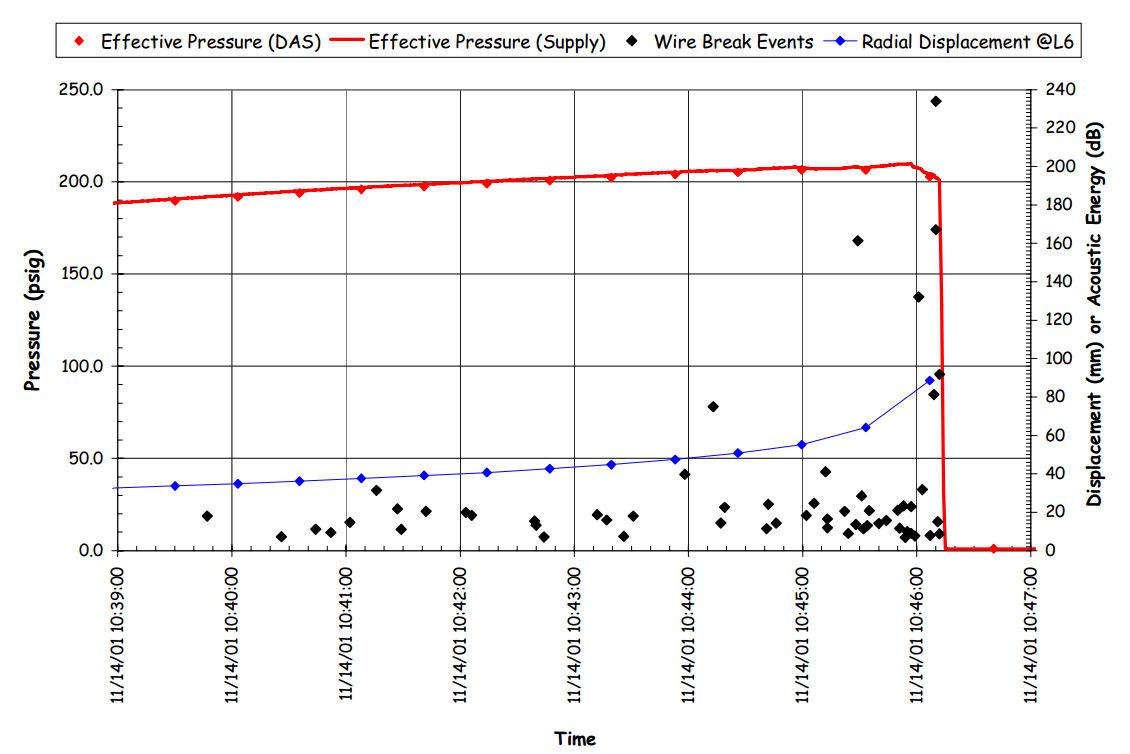
The second interesting bit of data is the Tendon break events. The plot below shows the Tendons that broke leading up to failure of the vessel. Notice that these breaks all happened in an interval of only 7-8 minutes.
The radial dimensions that they measured show the same trend continued for failure testing. Notice in the figure below that the largest deformation is occurring at about the middle height of the sidewall.
Comparison with Analysis
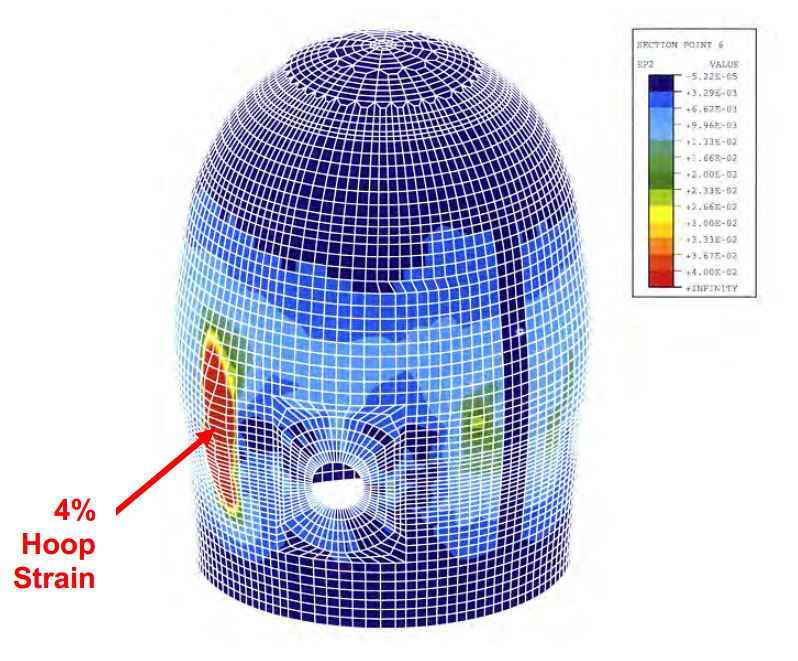
A detailed analysis of the model was done to show how the failure had evolved. They found that the termination of the equipment hatch reinforcement happened near the 6-degree azimuth, near the location of the failure. As you can see, the model correlates very well with the actual test data.
Testing and FEA at XCEED
At XCEED, we also do testing and Finite Element Analysis/Computational Fluid Dynamics. If you’d like to talk about performing a test, or a Finite Element Analysis (FEA) or Computation Fluid Dynamics (CFD) problem, give us a call. You can see more of our Finite Element Analysis experience on our Finite Element Analysis Page.