Using structural shell elements in finite element analyses saves computational time when analyzing thin-walled parts and structures. But engineers and analysts require experience to best utilize the output. Unlike solid elements, where stresses are typically straightforward to understand, the analyst must be even more careful and be mindful of several questions when interpreting shell element stresses.
Two questions any engineer should answer when post-processing FEA are:
- What do these results quantify?
- How is this data going to be used?
But you can’t stop there when you’re using shells. There are more details that need to be considered:
- What is the accuracy and limitations of plotted stresses?
- Are only nominal stress results needed?
- Are local hot spot stresses needed for fatigue analysis?
- Should I use plotted stresses in a bolted or welded region?
- When should forces and moments be used instead of stresses?
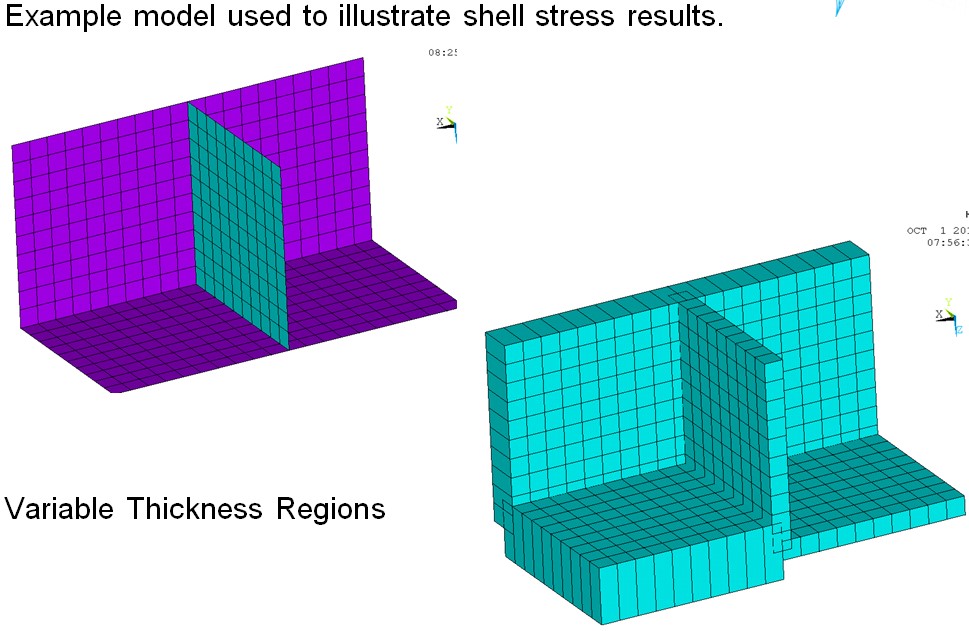
Figure 1 illustrates a shell model of a local connection, used to address all of these questions.
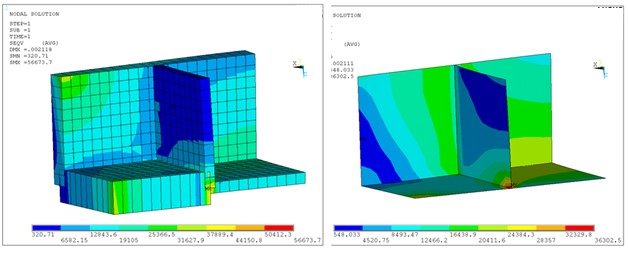
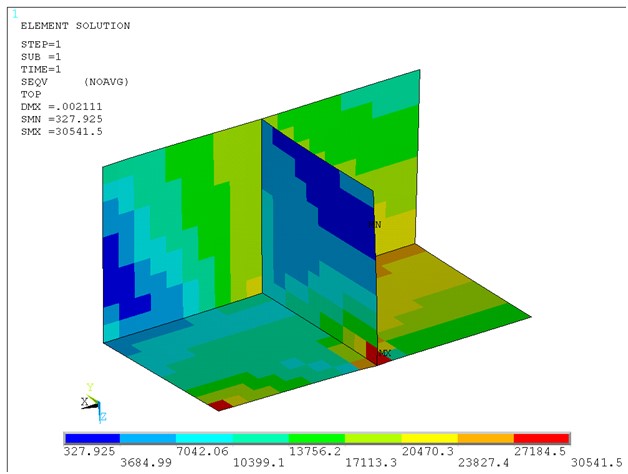
Depending upon the plotting method deployed, a wide range of results can be created. Two extreme results are illustrated in Figure 2. The peak stress in the left image is almost double the peak stress on the right. These are identical models, yet results change drastically when using a different plotting method.
The accuracy and limitations of plotted stresses
Both stress plots illustrated in Figure 2 are an approximation. Shell models at the intersection between plates create a singular condition. Stresses are approximate due to the mid-plane node sharing and plate overlapping. The overlap effect presents an inherent stiffness inaccuracy in the model.
Sometimes this effect can be reduced by offsetting the shell nodes so that they are located at the shell top or bottom surface instead of the mid-plane. The stress singularity issue will still remain, however.
In Figure 2, the stresses on the left represent stresses that are independently plotted on both the top and bottom surfaces of the shell elements. These stresses represent a calculation consistent with the independent plate geometries. On the right, nodal stress averaging is done between plates of different thicknesses and directions, where the surface stresses of each plate are averaged together.
The results on the right are garbage! When plotting shell stresses, isolating plates independently is preferred to avoid non-physical averaging. It is also important to account for whether the plot is illustrating the top and bottom (shown with the 3D shape), top-only, bottom-only, or mid-plane stress.
Are only nominal stress results needed?
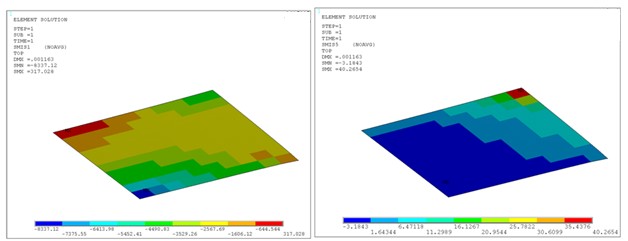
If the loading is not cyclic and the analysis goal is to compute plate/slab ultimate capacity, then nominal stresses might be a preferred output. Nominal stresses can often be evaluated using element centroid stresses to reduce the singular stress influence (See Figure 3).
Since centroidal stress averaging only occurs between the individual element integration points, the entire connection can be plotted without the fear of non-physical averaging. It should be noted that top and bottom surfaces are typically evaluated independently. A relatively coarse mesh can be used with this approach.
Calculating local hot spot stresses needed for fatigue analysis
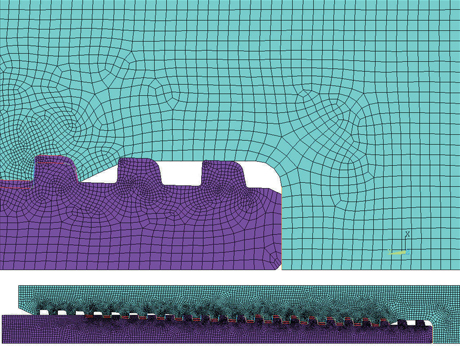
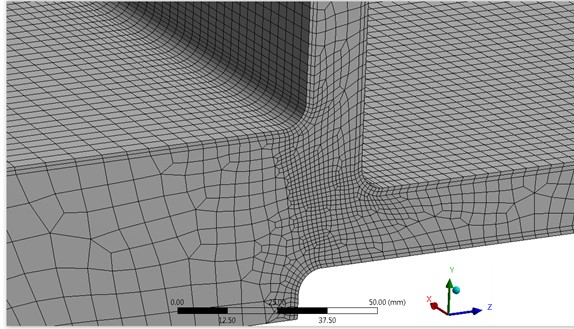
If fatigue life is an issue, then accurate stress results are required. If the peak stress is at a casting or machined joint, then a 3D brick model with fillet radii should be used to predict the true stress concentration. Shell-to-solid sub-modeling is often used for this type of simulation. Figure 4 illustrates filleted plate interfaces where local detailed stresses are calculated.
How to best use plotted stresses in a bolted or welded region
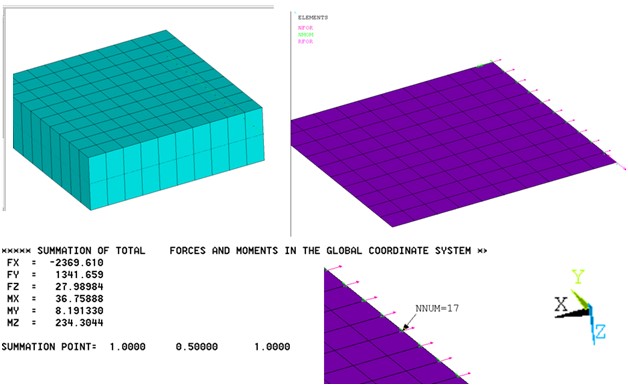
If the plate assembly is welded or is a bolted connection, then designing is often better achieved by extracting local forces and moments rather than using stress data. Figure 5 illustrates forces extracted from the end of the thicker plate at the joint connection.
When forces and moments should be used instead of stresses
In many structural design codes, stress data is not needed anywhere. Forces and moments are required code input. Generally, the preferred format is in-plane forces and out-of-plane moments, typically defined as force or moment per unit length. Each plate is isolated independently to capture these forces and moments at the element centroids as illustrated in Figure 6.
So, take advantage of the computational efficiency of shell modeling, but be careful about extracting the best results to best meet your analysis goals!